You ran a campaign last month. Your boss asks, "How'd it do?" You pull up a dashboard with 47 metrics and say something vague about impressions being "really strong." Your boss stares at you. You stare at the dashboard. Nobody knows what happened.
This is how most teams measure marketing campaign effectiveness. Badly. (For email-specific metrics, see our email campaign performance metrics guide. For attribution, check out revenue attribution explained. And always be A/B testing.)
The fix is stupidly simple: pick the right numbers, track them properly, and stop pretending vanity metrics are real results.
Setting Clear Goals for Your Marketing Campaigns
Likes, shares, retweets. They feel amazing. They mean almost nothing.
If your campaign goal is "get more engagement," congratulations, you've said nothing. Are you trying to drive sales? Capture leads? Get your brand in front of people who've never heard of you? Each of those needs completely different metrics. Mixing them up is how you end up with a beautiful report that proves absolutely nothing.
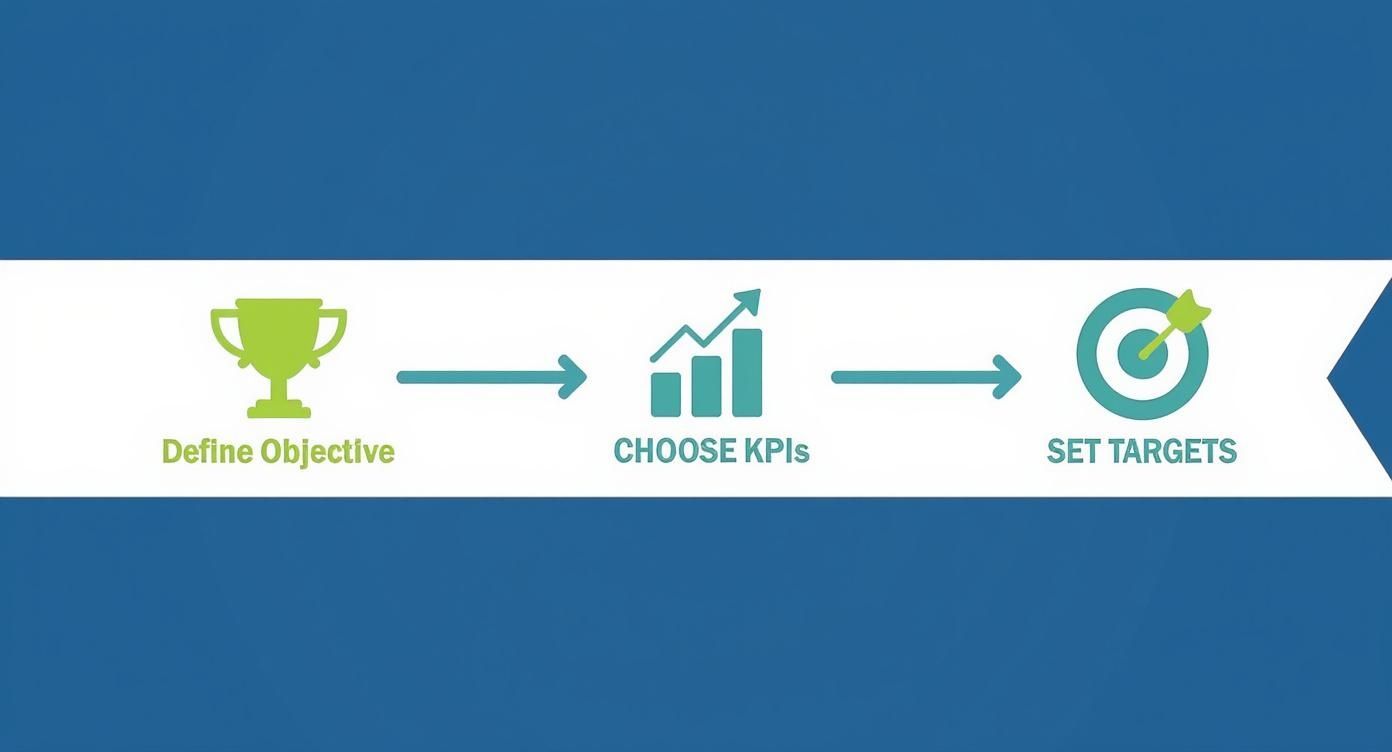
Define Your Primary Objective
One goal. Not three. Not "brand awareness AND lead gen AND sales." One. Your answer here shapes every other decision.
- Increase Direct Sales: This is the lifeblood of online shopping. Success is simple. Did people buy something because of this campaign?
- Generate Qualified Leads: For most B2B companies, this is the main goal. You want demo requests or contact form submissions from people who fit your product.
- Boost Brand Awareness: If you're new to the market, your primary goal might just be getting more people to recognize your brand name and what you do.
Choose Your Key Performance Indicators
KPIs are just numbers that tell you if your one goal is working. That's it. Don't overcomplicate this.
Lead gen campaign? Track demo requests. Email campaign? Track conversions, not opens. (We have a guide on improving email open rates if that's your thing, but opens alone are a vanity metric. Sorry.)
Top-performing marketing teams are 1.4 times more likely to use revenue as their primary KPI and 2.5 times more likely to track total sales than everyone else. They skip the fluff and measure what actually pays the bills. Weird how that works.
Choosing Your Measurement Tools and Attribution
This is where most teams fall apart. They set goals, get excited, and then have zero tracking in place. So they guess. For months.
UTM parameters are tiny tags you add to URLs that tell you exactly which ad, email, or social post drove someone to your site. Without them, your analytics dashboard is basically fiction.
Then there are tracking pixels from Meta or TikTok. These follow users from your ad to your website and tell you if they actually did anything useful, like buying something or filling out a form.
Setting Up Your Tracking Foundation
All this data needs to live somewhere. For most people, that's Google Analytics 4 (GA4). Set up event tracking to capture what people actually do on your site: form fills, video plays, downloads. Connect everything correctly and you finally stop guessing.
Every piece of tech should tie back to a result you care about. If it doesn't, kill it.
Understanding Marketing Attribution
Now the fun part. Someone converts. Which touchpoint gets the credit? The first ad they saw? The email they clicked? The blog post they read at 2 AM?
This is marketing attribution, and it starts arguments in marketing teams constantly.
Choosing the Right Attribution Model
Different models tell completely different stories about what's working. Pick wrong and you'll pour budget into channels that aren't actually doing anything.
| Attribution Model | How It Works | Best For |
|---|---|---|
| First-Touch | The first channel a customer interacts with gets 100% of the credit. | Top-of-funnel awareness and demand generation. Shows what brings new people in. |
| Last-Touch | The last touchpoint before a conversion gets 100% of the credit. | Campaigns focused on closing sales and driving final decisions. |
| Linear | Credit is split evenly among all touchpoints. | Long sales cycles where every interaction matters equally. |
GA4 lets you toggle between models. Play around with them. Watch how the story changes depending on which one you pick. It's kind of unsettling, honestly.
Analyzing Your Campaign Data for Real Insights
Collecting data is the easy part. Everyone can do that. The hard part is figuring out what any of it means. Knowing how to measure marketing campaign effectiveness is useless if you just stare at dashboards and nod thoughtfully.

Stop reporting what happened. Start figuring out why it happened.
Digging Deeper with A/B Testing
A/B testing. Two versions, one winner. This isn't complicated, but people somehow still mess it up constantly.
You can A/B test almost anything:
- Email Subject Lines: Does a subject line with an emoji get more opens?
- Landing Page Headlines: Which headline gets more people to fill out a form?
- Ad Creative: Does a video ad drive more clicks than a static image?
Change only one variable at a time. Otherwise you learn nothing. For more on what to track, check out 8 key email marketing performance metrics to track in 2026.
Understanding Customer Behavior with Cohort Analysis
Cohort analysis is just grouping users by when they showed up and watching what they do over time.
Say you run an online store. Grab everyone from your December sale. Watch them for six months. Do they buy again? How do they compare to customers from a slow month like August? If your big sale only brought one-time buyers who never came back, that campaign wasn't as great as you thought. Sad.
Calculating Your Marketing Return on Investment
Your CEO doesn't care about impressions. Your CFO doesn't care about click-through rates. They both care about one thing: did we make money?
The Financial Metrics That Really Matter
Two formulas. That's all you need.
- Return on Investment (ROI): (Sales Growth - Marketing Cost) / Marketing Cost. This gives a percentage of profit per dollar spent.
- Customer Lifetime Value (LTV): The total revenue you expect from one customer over their time with your brand. A high LTV means loyal fans, not just one-time buyers.
How to Know if Your Ads Are Actually Working
Return on Ad Spend (ROAS) tells you how many dollars you earn for every dollar you spend on ads. That's it. No fancy interpretation needed.
A healthy ROAS is 4:1, meaning $4 back for every $1 spent. If you're hitting that with an average e-commerce conversion rate of around 2.5%, you're doing fine. Sometimes the channels you'd never expect, like podcasts or even radio, deliver the best ROAS. Measure everything. Your gut is wrong more often than you think.
Turning Data into Smarter Decisions and Clearer Reports
Data without action is just a screensaver. The point is to use it to make better decisions and prove to your boss that marketing isn't just coloring.

Finding Your Reporting Rhythm
Build a dashboard with your 3-4 main KPIs. Big numbers, simple charts. If your report is longer than one page, nobody's reading it.
Brands lose an average of 2% of future revenue for every quarter they go dark on advertising. So consistent reporting isn't just nice to have. It's how you keep your budget from getting cut.
Common Questions About Measuring Campaigns
Most teams have messy data and don't even know it. UTM parameters are spelled three different ways. Pixels aren't firing. Half the team uses "Spring_Sale" and the other half uses "spring-sale" and now you've got two campaigns in your analytics that are actually the same thing. Fun.
- Ensure UTM Consistency by using the same naming pattern across every platform.
- Validate Pixel Loads so you know events fire when a page loads.
- Merge duplicates with Unique IDs to stitch records from multiple sources.
Metrics You Should Prioritize
Pick three or four. Ignore everything else. You can always add more later, but tracking 47 metrics means you're tracking zero of them well.
- Conversion Rate tracks the share of visitors who take your desired action.
- Return on Ad Spend (ROAS) shows how many dollars you earn for every dollar spent.
- Customer Lifetime Value (LTV) reveals how much a customer is worth over time.
If you can't explain a metric in one sentence, it's too complicated. Drop it.
Reporting Cadence Advice
Match your reporting rhythm to the campaign length. This isn't rocket science.
- Weekly for short A/B tests and rapid tweaks.
- Monthly when you juggle multiple channels or mid-size campaigns.
- Quarterly for big budgets and broad ROI insights.
Tweak your attribution models at each check-in. It's how you figure out which channels actually deserve more budget and which ones are just burning cash.
Ready to boost your email ROI? Book a free 30-minute audit with Inbox Connect.